Why we created it
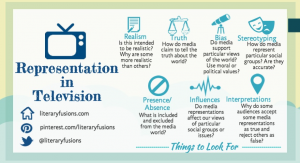
Media Literacy is a necessity for our students. Our students are immersed in media daily, inside and outside of school. Students need to learn how to analyze media’s messages, uses, and learn to create their own to send their own messages. Obviously this is an overwhelming amount of information to throw at students. We began by creating an infographic about representation in the media, focusing on gender, ageism, disabilities, and ethnicity. The infographic not only has guiding information and questions, but provides data in each of the areas. The infographic is “thinglinked” in order for students to see examples of the different types of representation.
Who we would give it to
Parents, educators, and secondary students who want to begin thinking critically about media on television. The intent is not to criticize media, but to understand what we are being exposed to daily. It is important to be active recipients of the messages being sent.
Who we hope to hear from
We would love to hear from you if you use this infographic for yourself, students, or children. Enjoy!
Technical Info
The inforgraphic was created with a tool called Piktochart. We’ve investigated several tools for creating the newly-popular infographics, and we’ve found this one to be the most user-friendly. The “layer of awesome” containing the links to examples and other information was added with ThingLink. Look for more information on this process and these tools in an upcoming post!


Leave a Reply